Step 1: Determine Class Intervals
The first step in calculating distribusi frekuensi is to determine the class intervals or ranges. These intervals should be mutually exclusive and collectively exhaustive, covering the entire range of values in the dataset. The number of intervals depends on the size of the dataset and the desired level of detail. Generally, it is recommended to have around 5-15 intervals for a clear representation of the distribution.
Step 2: Count the Frequencies
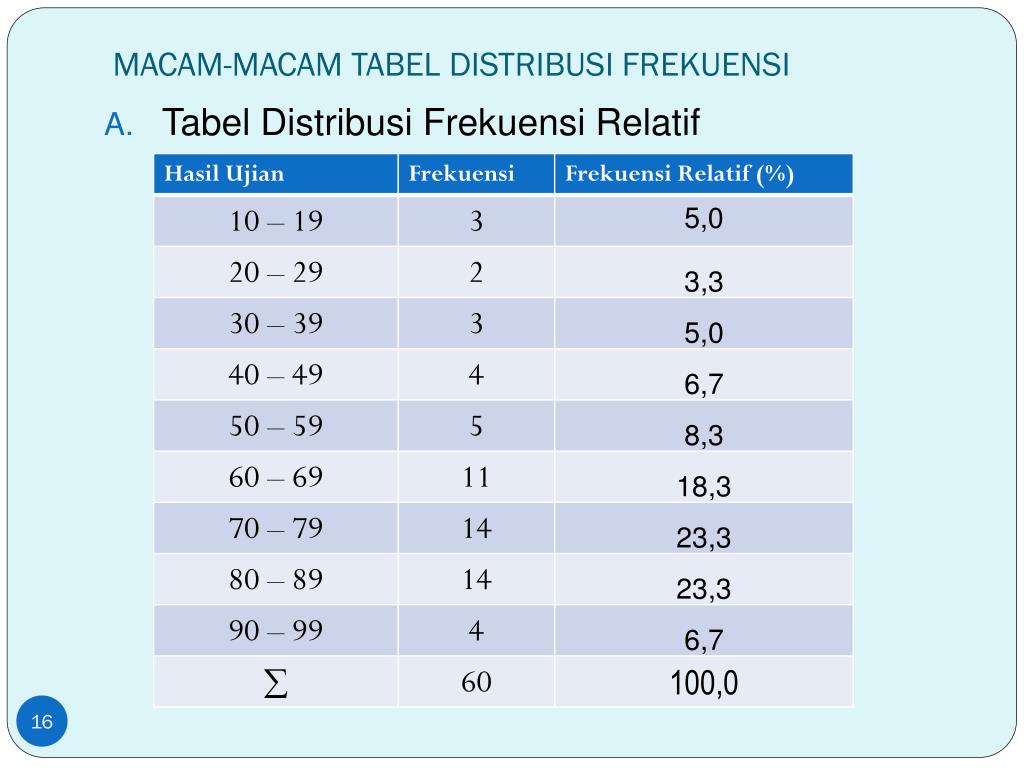
Once the class intervals are defined, the next step is to count the frequencies. This involves tallying the number of values that fall within each interval. For example, if we have a dataset of exam scores ranging from 0 to 100, and we choose an interval size of 10, we would count how many scores fall within each range (e.g., 0-10, 10-20, 20-30, and so on).
Step 3: Create the Frequency Table
After counting the frequencies, we can create a frequency table. This table includes the class intervals, the corresponding frequencies, and additional columns for relative frequencies, cumulative frequencies, and percentage frequencies. These additional columns provide a more comprehensive understanding of the distribution.

