Step 4: Visualize the Distribution
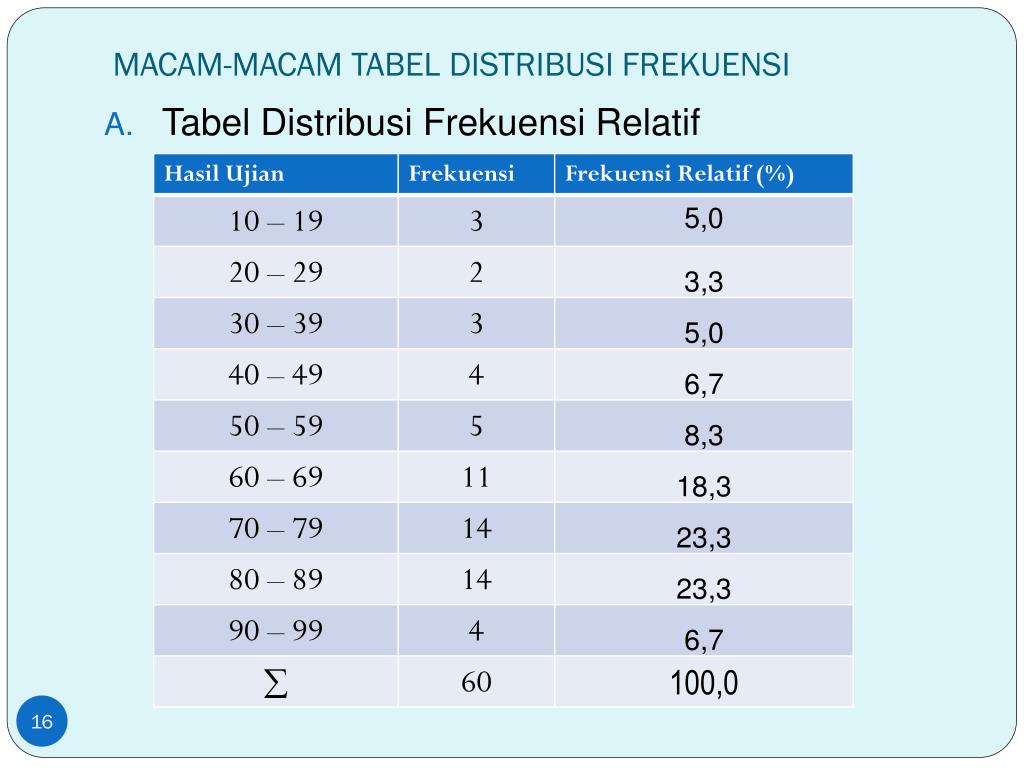
In addition to the frequency table, it is often helpful to visualize the distribution using graphs or charts. Histograms and bar charts are commonly used to represent distribusi frekuensi. These visual representations provide a clearer picture of the data distribution and facilitate easier interpretation.
Practical Applications of Distribusi Frekuensi
Now that we have covered the basics of distribusi frekuensi, let’s explore some practical applications in different fields:
Economics and Finance
In economics and finance, distribusi frekuensi is used to analyze income distribution, wealth distribution, stock returns, and various economic indicators. It helps in identifying income disparities, market trends, and risk patterns. For example, by analyzing the distribusi frekuensi of stock returns, investors can understand the probability of different levels of returns and make informed investment decisions.

