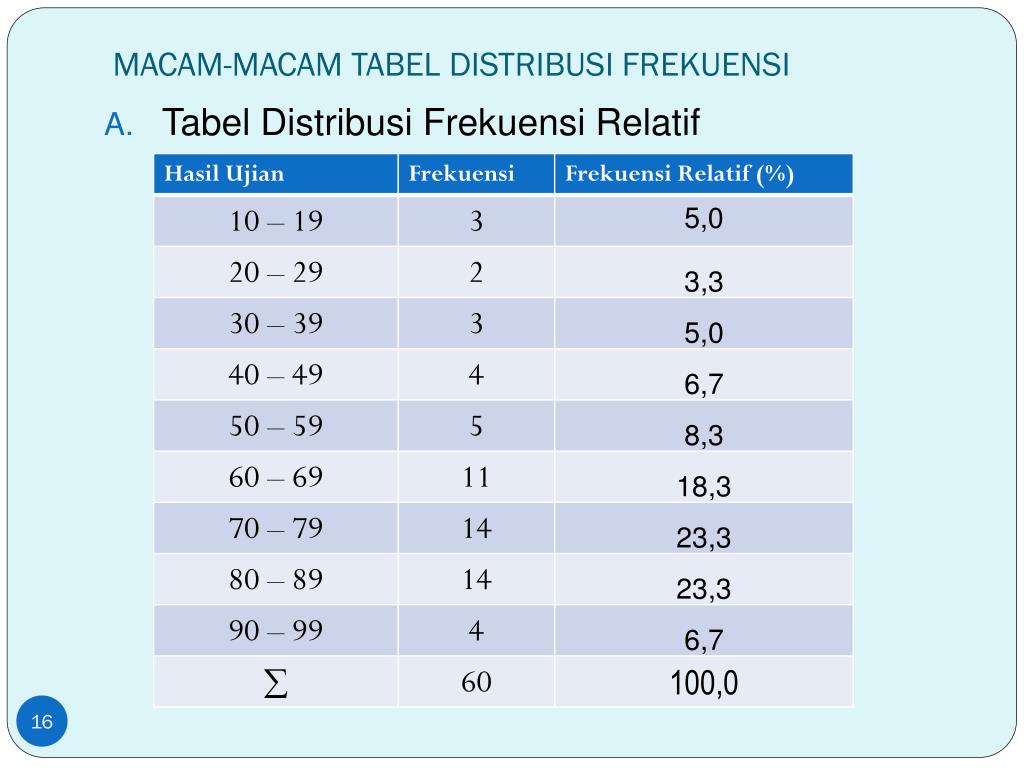
4. What is the purpose of relative frequencies in distribusi frekuensi?
Relative frequencies in distribusi frekuensi provide the proportion or percentage of values falling within each class interval. It helps in comparing the distribution across different intervals and provides a standardized measure of the frequencies.
5. How can I interpret a histogram based on distribusi frekuensi?
When interpreting a histogram based on distribusi frekuensi, you can analyze the shape, central tendency, and variability of the distribution. The shape can indicate whether the distribution is symmetrical, skewed, or bimodal. The location of the peak represents the mode or the most common value. The spread or variability can be assessed by examining the width of the distribution.
Summary
Distribusi frekuensi is a statistical technique used to organize and present data in a tabular form, allowing for a clearer understanding of the distribution of values. It is essential in summarizing large datasets, identifying patterns and outliers, calculating descriptive statistics, and visualizing data. Distribusi frekuensi finds applications in various fields such as economics, marketing, and social sciences, enabling researchers to gain valuable insights and make informed decisions. By understanding the concept and applying appropriate techniques, researchers can unlock the hidden information within datasets and uncover meaningful patterns.

